ACBAR Home
Science Goals
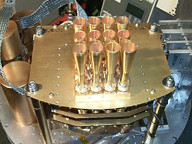
Instrument Description
Project Team
Publications
2008 Data
2006 Data
2002 Data
2008 Press Release
2002 Press Release
Photos
Links |
Science Goals
Determine the fine scale CMB Power Spectrum
 |
 |
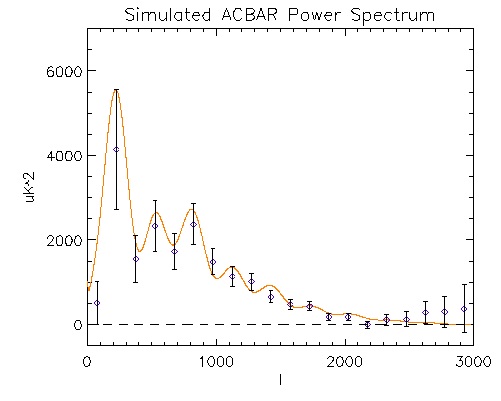
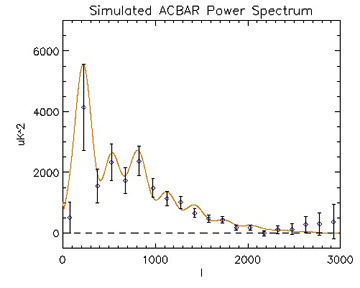
| simulated power spectrum |
other experiments |
 |
 |
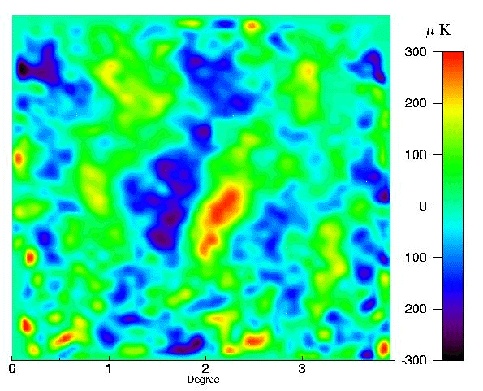
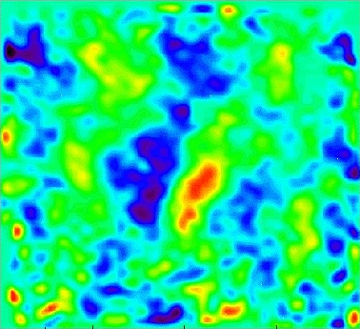
| CMB map at 150 GHz |
CMB map at 220 GHz |
A new generation of CMB experiments (BOOMERANG, DASI, and
MAXIMA) are beginning to realize the potential of CMB anisotropy
as a tool for precision cosmology. Simulated power spectra
depend strongly on the values of the cosmological parameters
(such as Ωo, Ho, Λ, and
ΩB) and can be compared with observations to
constrain cosmological models. The large chop and small beam of
the ACBAR receiver make possible high resolution spectroscopy of
spatial features of the CMB from angular scales corresponding to
l=200 to 3000. ACBAR extends the frontier of CMB anisotropy
measurement to angular scales more than a factor of two finer
than that achieved with previous experiments. The top panel
shows a simulated CMB power spectrum with the actual error bars
achievable with ACBAR. This is a significant improvement in
accuracy above l=1000 over previous experiments. (The real
ACBAR CMB Power Spectrum analysis is in progress and will be
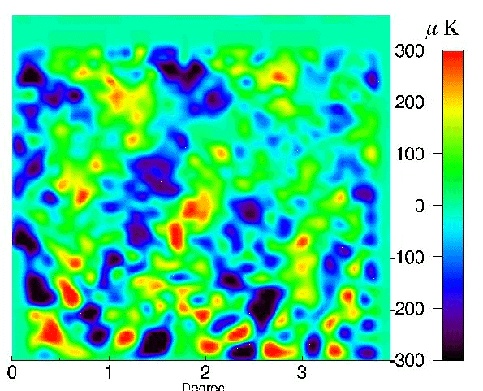
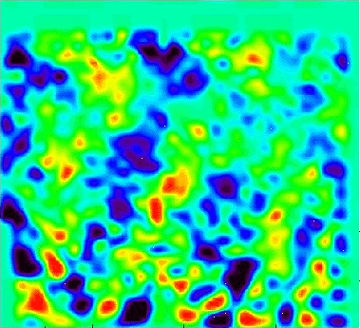
published shortly.) The bottom left panel shows a map of one
several deep ACBAR CMB fields at 150 GHz, taken during the 2001
South Pole winter season. The bottom right panel same field at
220 GHz. This particular CMB field is centered on
QSO 0454-463. The 150GHz plot has an RMS of 13 μK in a
5’ beam. Note that the temperature differences of the
CMB between hot and cold regions is around 300 μK, or
approximately one part in ten thousand of the CMB temperature;
in the center of the map, these fluctuations are measured with
signal to noise >10.
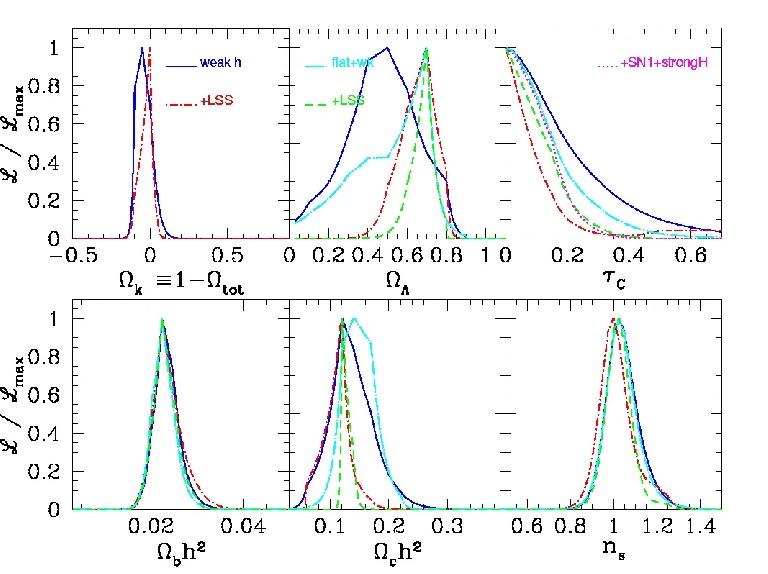
Cosmological Parameter Estimation
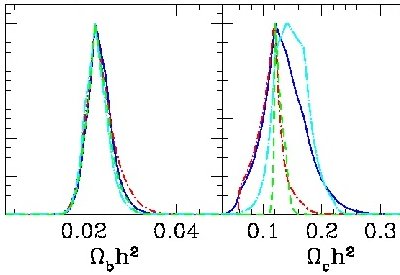
The CMB Power Spectrum can be used to place limits on the
certain cosmological parameters. A theoretical power spectrum may be
calculated for any combination of Ωtot,
Ωbaryon, Ωcdm, Λ, H0,
and so forth. By comparing these spectra with our actual experimental
spectrum, we can determine the likelihood for each of these
cosmological parameters to have certain values.
The above plot shows likelihoods of some cosmological parameters
calculated without ACBAR data.
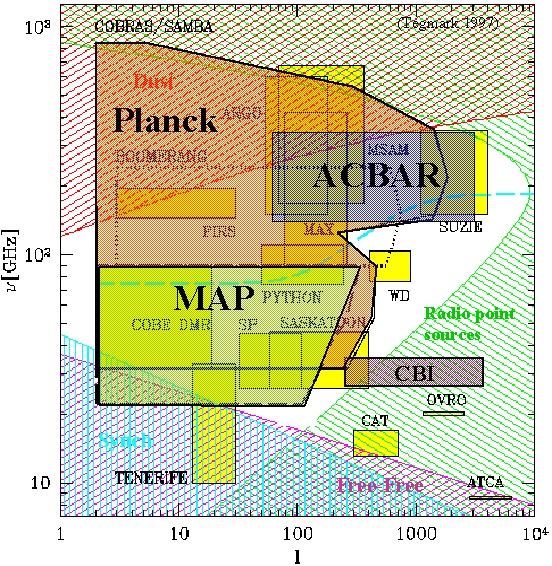
CMB Foregrounds
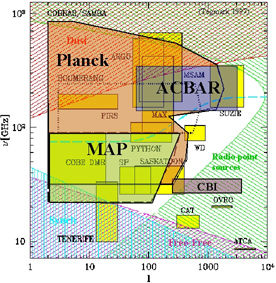
This plot shows the various foreground contaminants that CMB
experiments have to contend with on the angular scale versus
frequency plane. The shaded regions are where dust,
synchrotron, free-free, and radio point source emission exceed
the predicted CMB anisotropy. The desirable region with the
lowest foreground levels is the white swath through the middle
of the plot. Also shown are the regions covered by many
experiments; ACBAR’s coverage is the purple box. (from Max
Tegmark's web page). ACBAR will provide constraints on
foreground emission of future missions such as the Planck
surveyor.
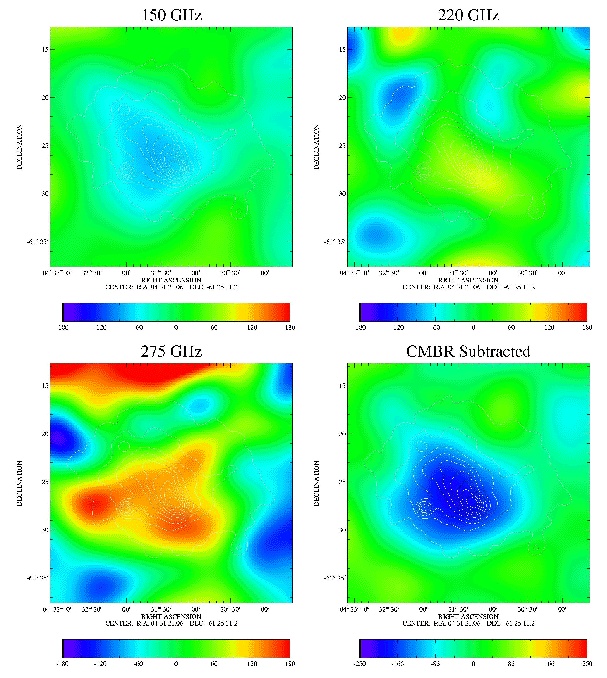
Map SZ Effect in known clusters:
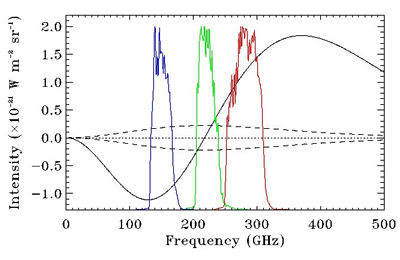
The CMB photons interact with hot, ionized gas trapped inside large
clusters of galaxies. This interaction causes a change in the CMB
spectrum, and was first calculated theoretically by Sunyaev and Zel'dovich
about 30 years ago. By measuring the CMB intensity at multiple
frequencies, it is possible to separate the original CMB signal from
what is now known as the Sunyaev-Zel'dovich (SZ) Effect.
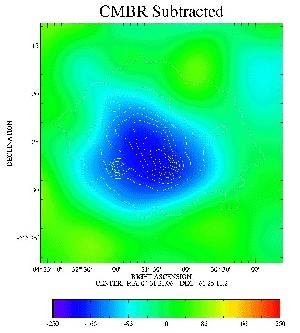
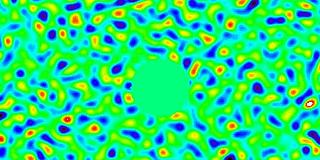
The first panel is a map of the Thermal SZ Effect from
Galaxy Cluster Abell 3266 (z=.0545, Tx=6.2 keV,
Lx=9.5x1044) measured by ACBAR. For
clusters of this angular size, it is necessary to use
multi-frequency observations to remove contamination by CMB
anisotropies which have comparable peak brightness. The white
lines are contours in X-ray flux from ROSAT observations. This
map, and others like it are being used to probe the
distribution of hot gas bound to massive clusters of galaxies
and provide an independent determination of baryon fraction and
Hubble constant.
The second panel is a plot of the frequencies covered by each of the
three current ACBAR bands (blue, green & red lines) along with the
CMB intensity change due to the SZ Effect (black line).
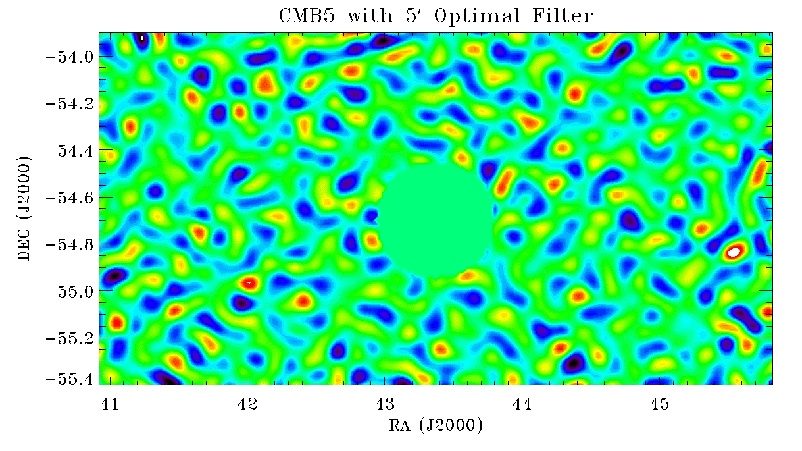
Search for Distant Galaxy Clusters:
The evolution of the number density of clusters of galaxies
depends strongly on the value of the matter density. For a low
value of matter density, clusters stop forming at low redshift,
thus more had to form earlier to match the presently observed
number density. With ACBAR's sensitivity and 4’ beam size
, which is more sensitive to distant cluster emission than
previous CMB experiments. The spectral response of ACBAR will
allow us to distinguish between emission due to the SZ effect,
CMB anisotropies and foreground emission. The analysis of the
deep ACBAR maps for cluster candidates is in progress. This is
an optimally-filtered frequency-subtracted plot with 5’
Beam Size. The RMS is ~4mK in 5’ Beam. Follow-up
observations are in progress.
|