Observations and Results
BIMA Observations
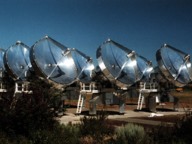
All anisotropy observations were made using the BIMA array in Hat Creek,
CA. Nine 6.1 m telescopes were equipped for operation at 28.5
GHz, providing a 6.6' FWHM field of view. All field
observations were bracketed by observations of bright radio
point sources in order to track the phase fluctuations caused by
the instrument and the atmosphere.
The survey consists of 10 fields of fairly uniform depth. The
average field was observed for 50-60 hours, achieving a noise
level of ~150 uJy/beam on short baselines. The noise level
corresponds to a temperature sensitivity of ~15 uK for a 2'
synthesized beam. Each of these fields was then analyzed for
signal that exceeds what is to be expected from instrumental
noise. This excess power is thought to be caused by signal from
CMB anisotropy.
VLA Observations
Emission from radio point sources at 28.5 GHz is expected to
contribute significantly to excess power in the BIMA
observations. The compact configuration has limited sensitivity
to discriminate between extended emission and point sources. To
help constrain the contribution from point sources to the
anisotropy measurements, we used the Very
Large Array (VLA) at a frequency of 4.8 GHz to observe each
field in the survey. With 1.5 hr per field, we identifed the
positions of all point sources with flux greater than 6 times
the noise level in the map at 4.8 GHz.
 Assuming the flux of a radio point source decreases or remains
relatively flat with increasing frequency, the VLA observations
should be deep enough to identify all point sources that lie
near the noise level in the 28.5 GHz BIMA maps. The
contribution of point soures to estimates of anisotropy can then
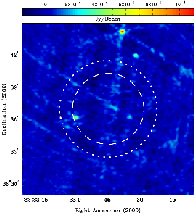
be removed knowing only the positions. Below is an example of an
image from the VLA observations. The inner dashed circle
represents the primary beam of the BIMA telescopes while the
outer dotted circle represents the primary beam of the VLA
telescopes.
Results

A significant level of excess power was found in the anisotropy
survey. Combining the sample of ten fields, we find a level of
excess power that exceeds the expectation from instrumental
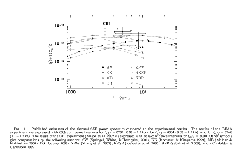
noise by better than 95% confidence. To the left is a figure
that compares the results of this work with the results from the
Cosmic Background
Imager (CBI) and theoretical models. A description of the
data analysis and a detailed explanation of the results of the
experiment can be found in our most recent paper. As
described by Komatsu and
Seljak, the results favor a σ8=1 cosmology.
Keep posted for results from our last summer of observation with
which we doubled the size of the survey.
Planned Follow-up Observations
The SZ effect is believed to be the most likely candidate for the
excess power detected in the BIMA fields. However, independent
observations with an optical telescope are required in order to
confirm that the signal is indeed caused by clusters of galaxies.
We have applied for observing time with the
Apache Point Observatory (APO) to observe the 10 fields in
the anisotropy survey.
With observations in the V band to a limiting magnitude of
M=25, and observations in the I band to a limiting magnitude
of M=24, we hope to identify the galaxies
associated with a cluster. A cluster would appear
as an overdensity of objects of the same color.
Correlating the optical data with the BIMA data should produce
a sensitivity to low mass clusters that would not otherwise
be identified in a single measurement.
|


