Overview
This paper uses 2 seasons of POLARBEAR observations to measure the CMB B-mode polarization power spectrum. The paper has been submitted to ApJ and can be found on the arXiv.
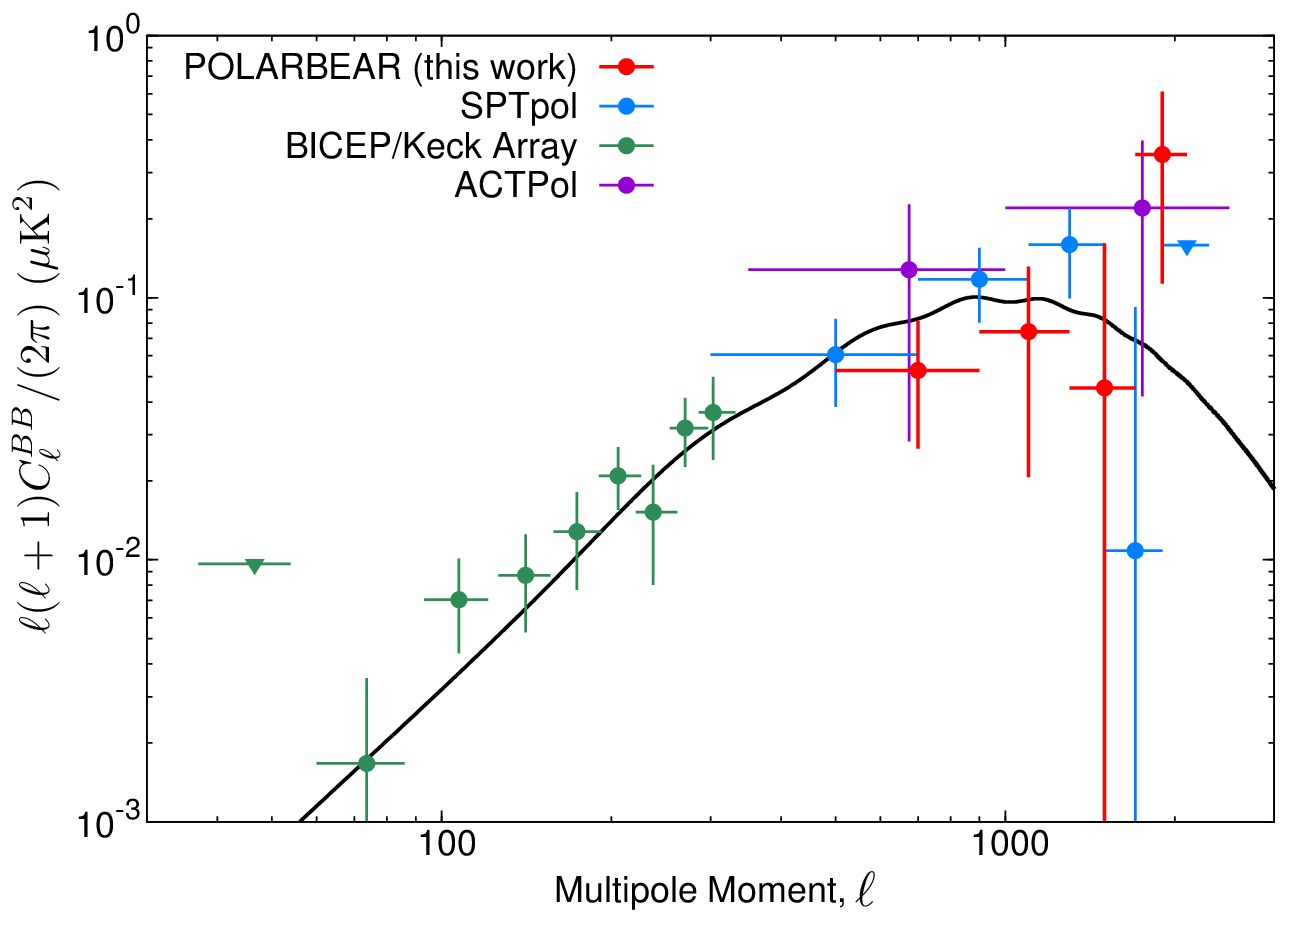
The figure on the right shows the POLARBEAR bandpowers in red against other recent B-mode measurements from SPTpol (blue), BICEP/Keck Array (green), and ACTpol (purple). The error bars represent 68.3% confidence intervals, while the downward triangles represent 95% CL upper limits.
POLARBEAR Maps
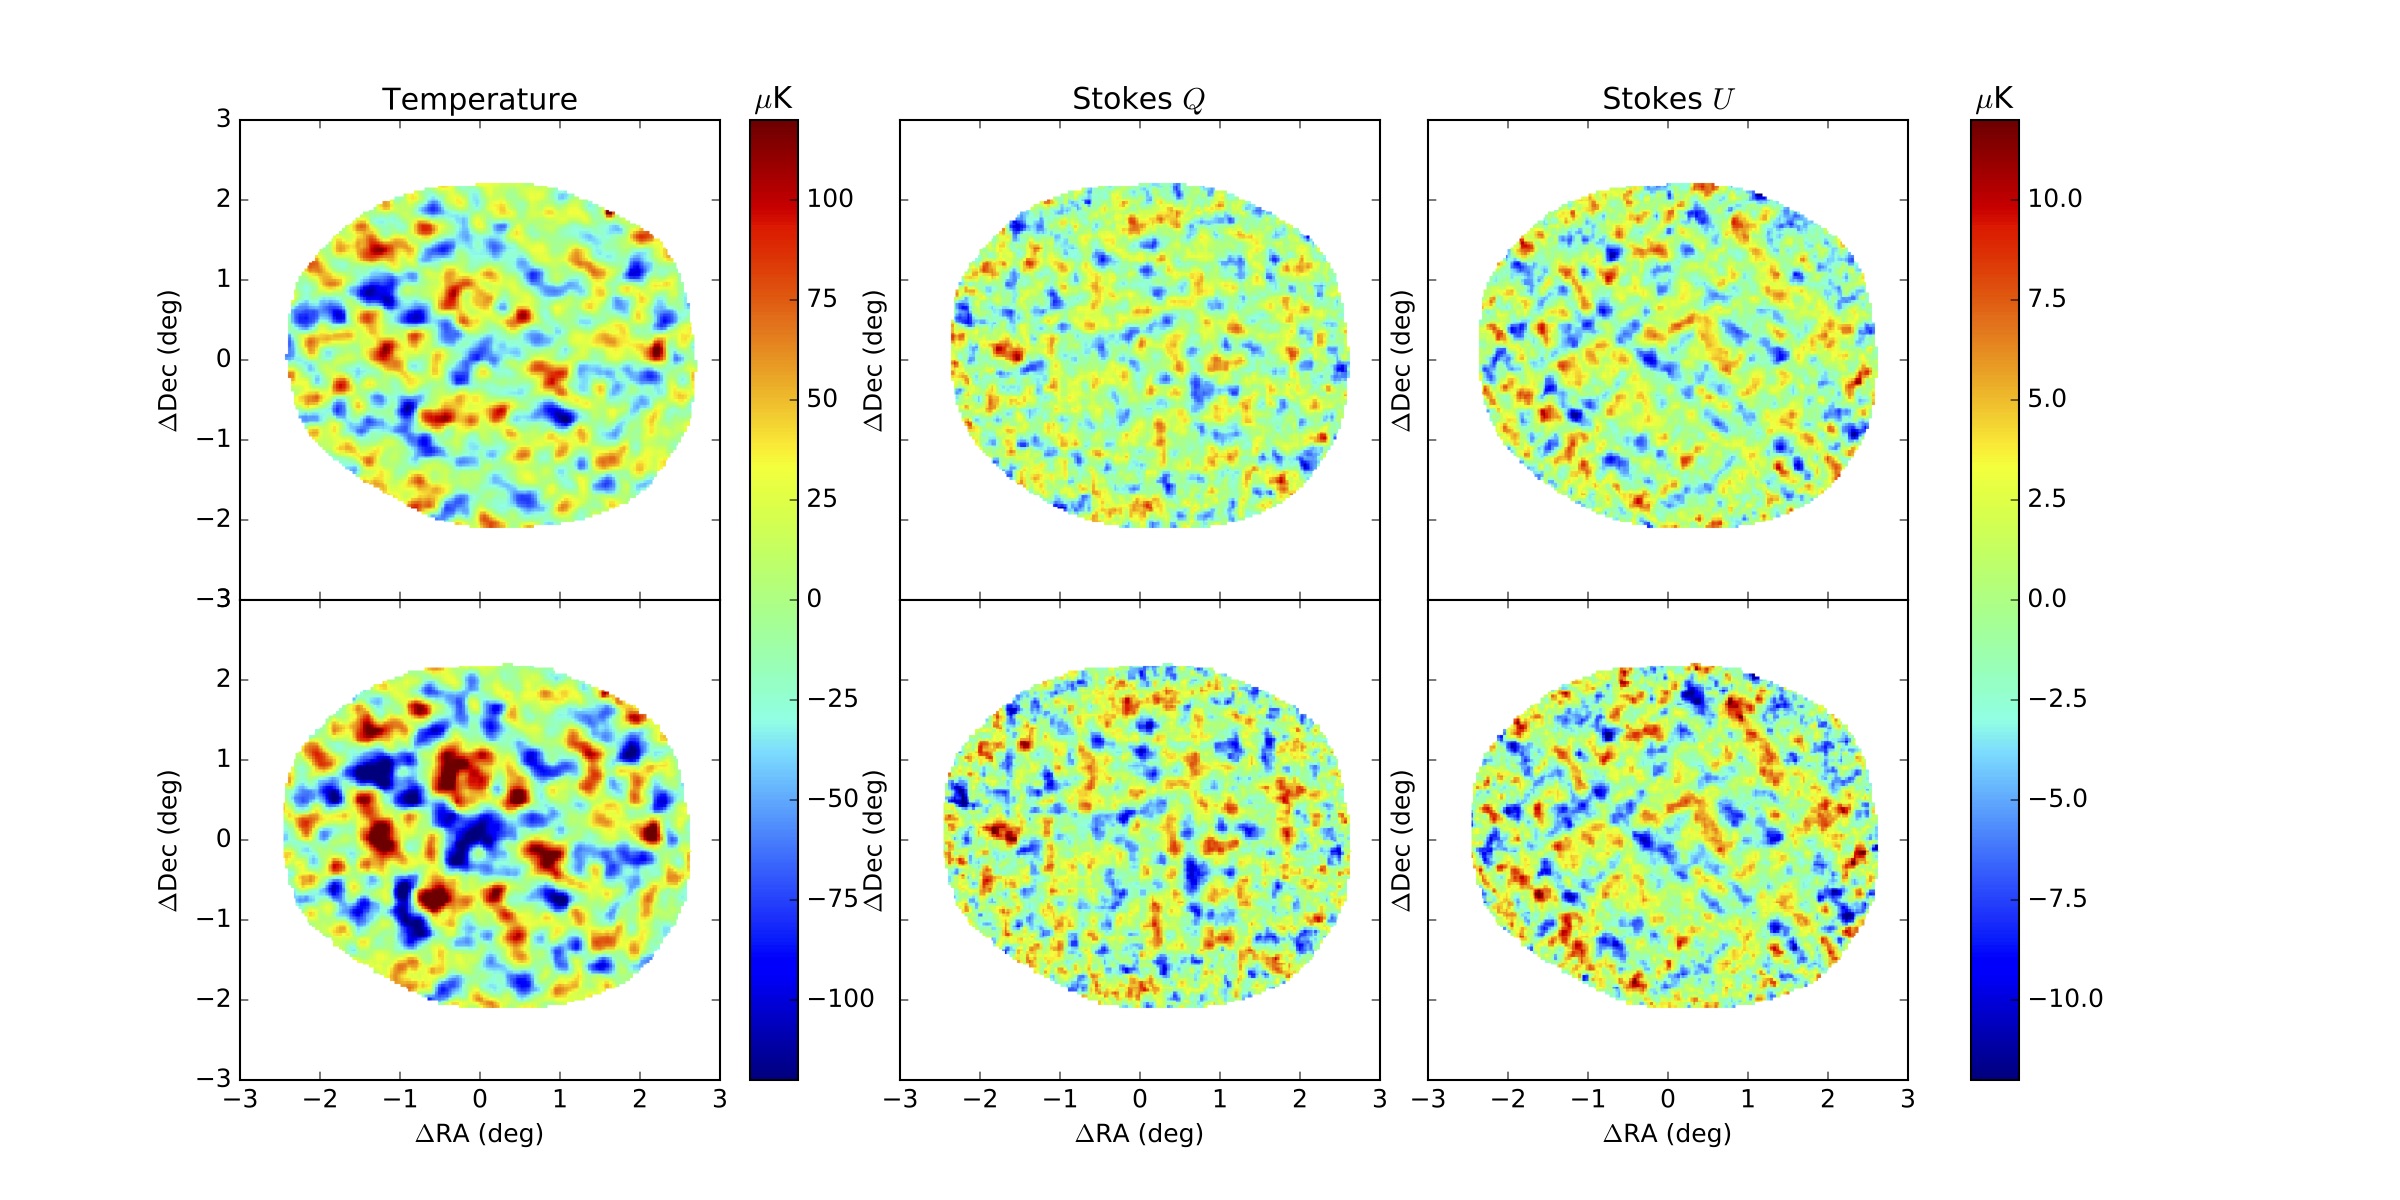
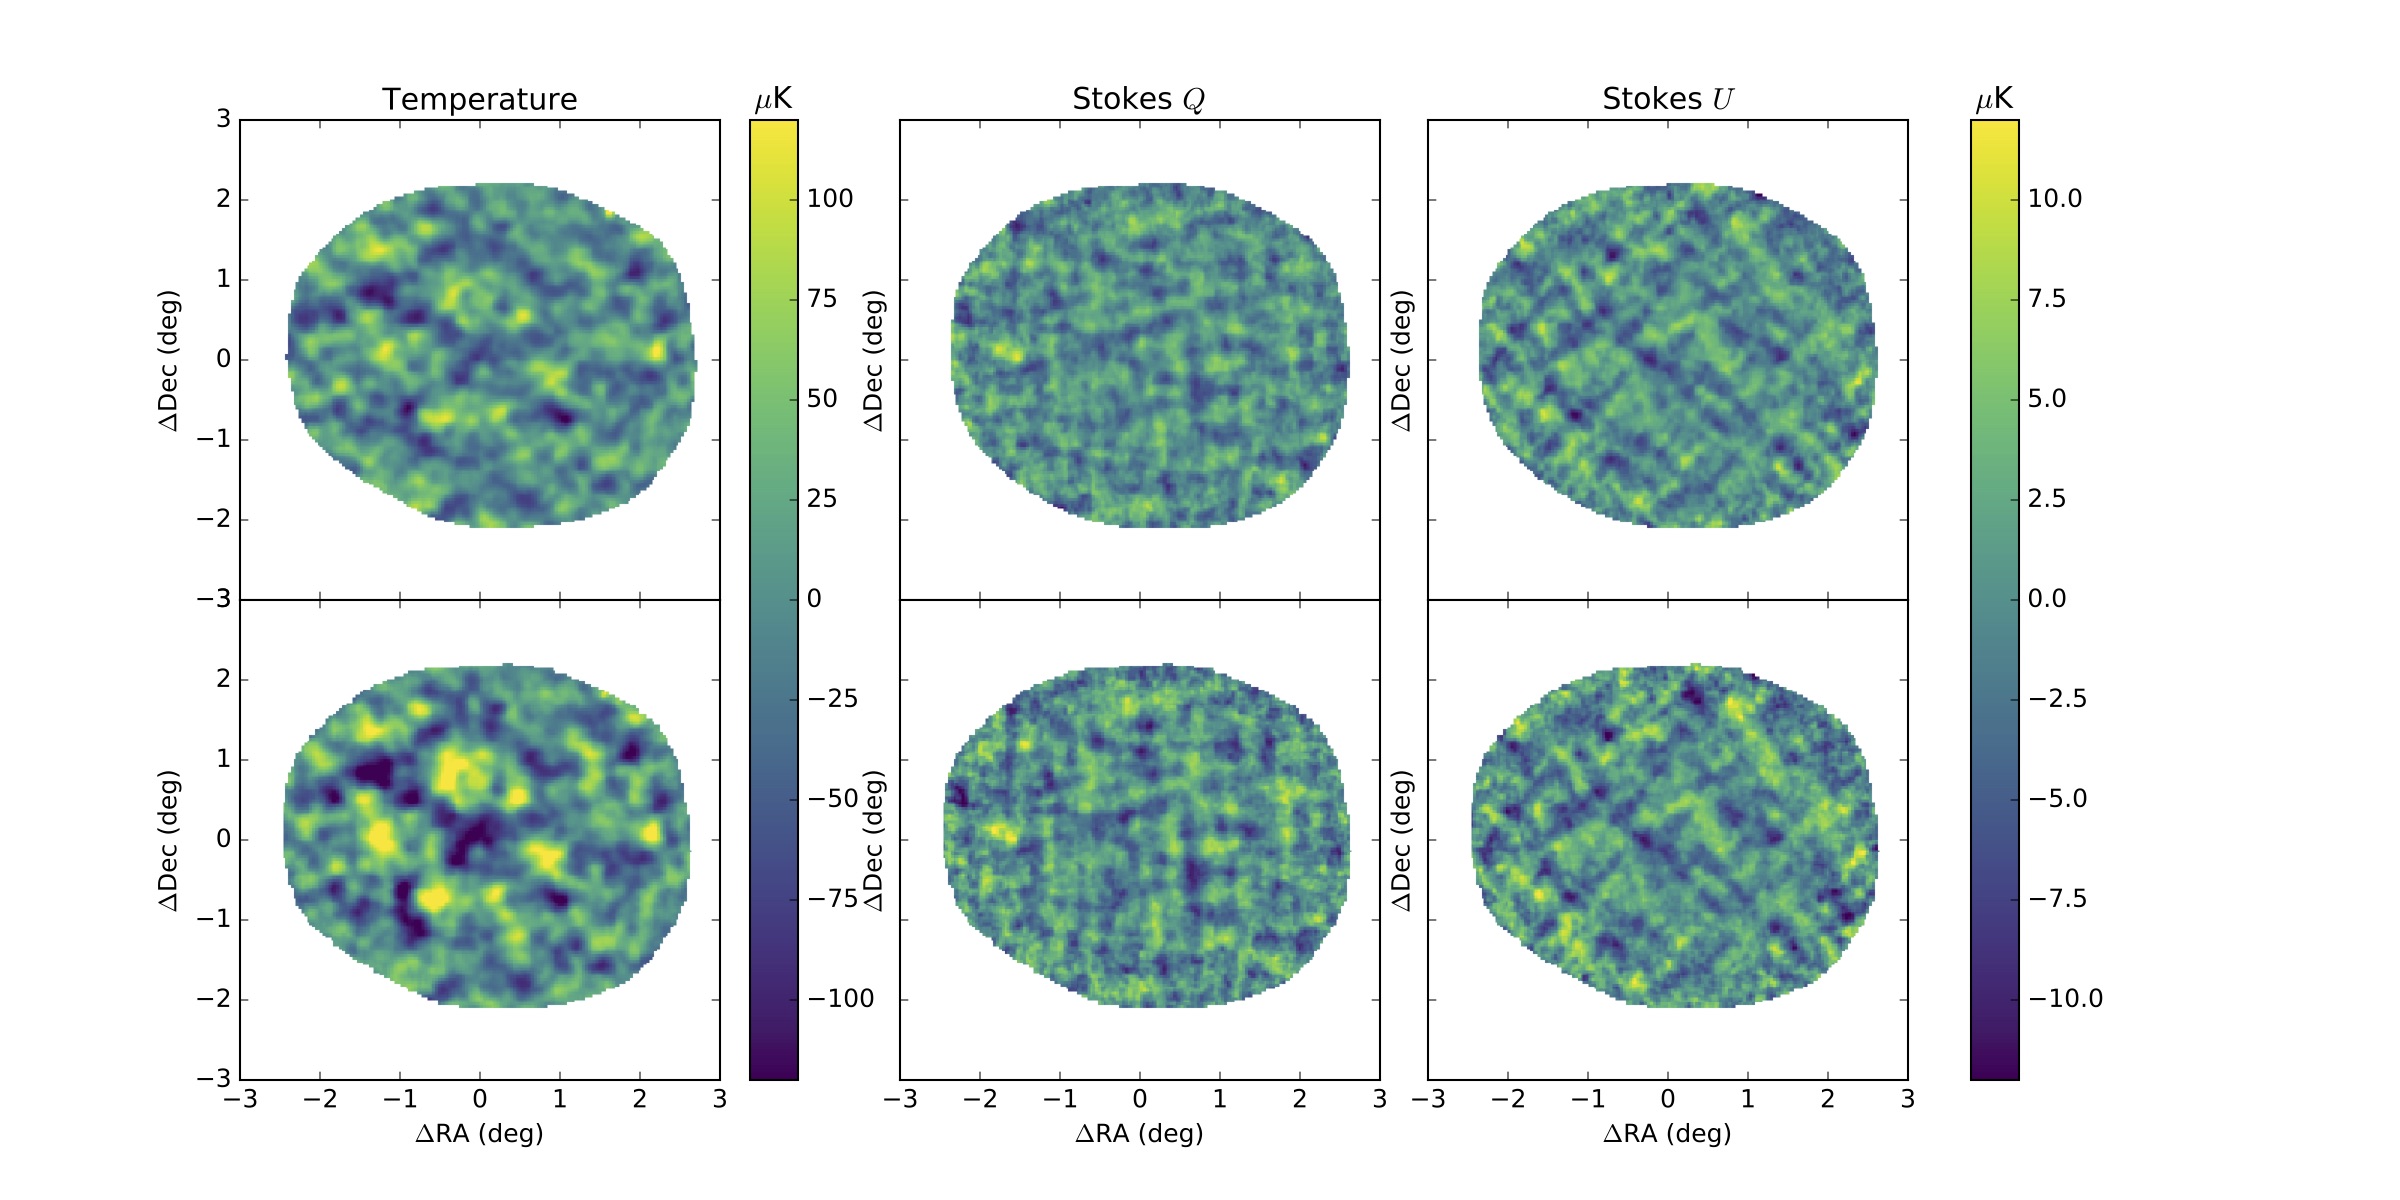
Polarbear CMB intensity and polarization sky maps of RA23 in equatorial coordinates. The left, center, and right panel show temperature anisotropy, Stokes Q, and Stokes U, respectively. The top maps are generated by pipeline A and the bottom ones are generated by pipeline B (resampled with map pixel width of 2′ and reprojected on a cylindrical equal area projection to ease the comparison). For both sets of maps, and for visualization only, we show an area in which the map weights are above -10 dB. The polarization angle is defined with respect to the North Celestial Pole. While the structures are clearly in agreement between the two sets of maps as expected, the amplitude of the signal is different due to the fact that the two pipeline treat differently the amplitudes of the modes in the maps (Section 4.1 for details). Note that these maps are smoothed with a Gaussian filter with 3.′5 FWHM for visualization. The maps are shown with either the jet or viridis color scale.
Plotting data
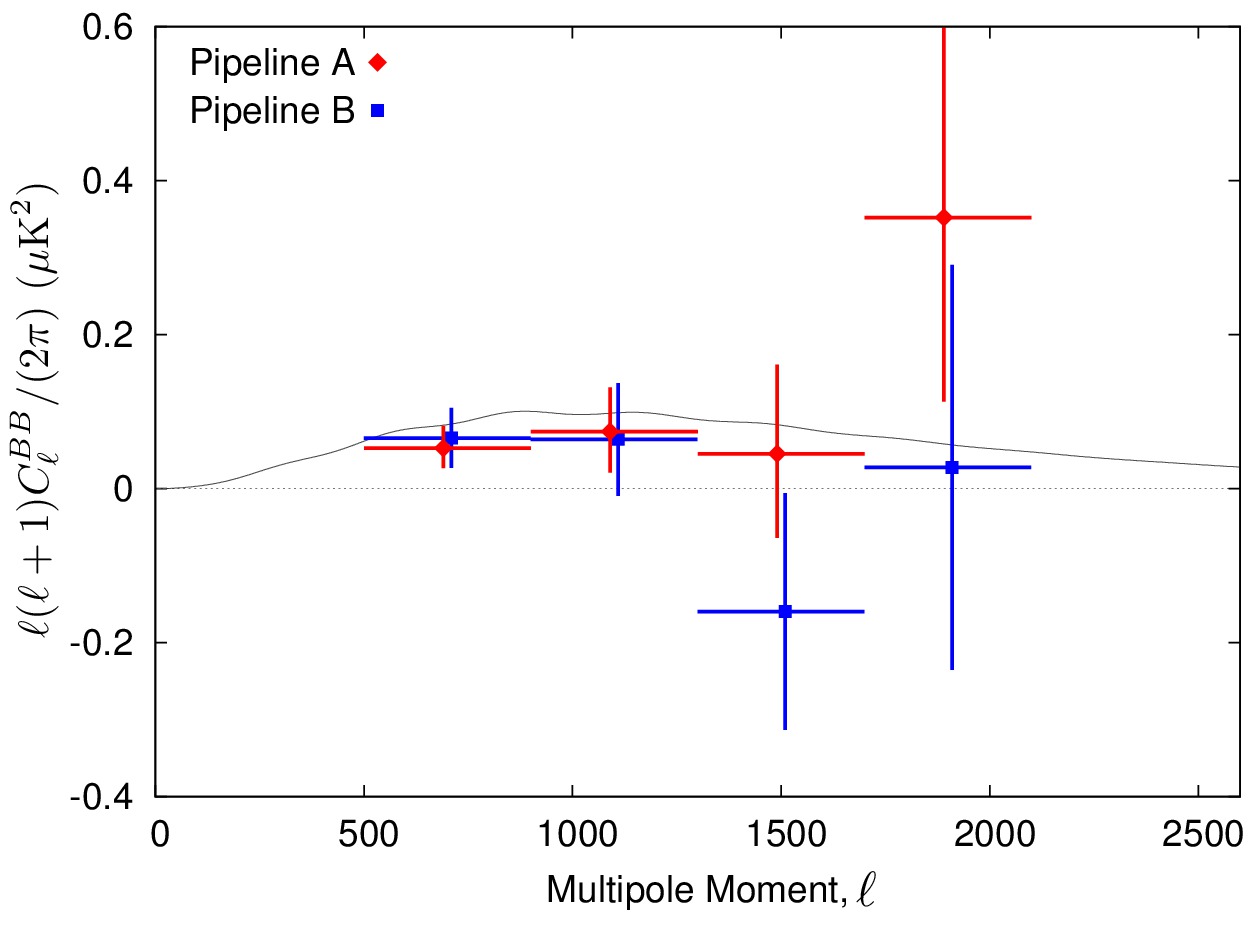
A table of the bandpowers and diagonalized uncertainties for plotting purposes is available here. The first column is the index, the second column is the minimum multipole in the bin, the third column the maximum multipole, the fourth column is the bandpowers for Pipeline A, and the fifth column is the square root of the diagonal of the covariance matrix (where the covariance matrix includes sample and noise variance, but not beam uncertainties or calibration uncertainty) for Pipeline A. The Sixth column is the offset of the offset-lognormal distribution. For the purposes of checking, a set of plots showing the likelihoods for each bandpower are in this tarball. Note that Pipeline A and B refer to the two independent analysis pipelines that were used to interpret the POLARBEAR data, please see the paper for full details.