Observations and Results
BIMA Observations
All SZ observations were made using the BIMA array in Hat Creek,
CA, and the OVRO
array in Big Pine, CA. Nine 6.1 m BIMA telescopes were equipped
for operation at 28.5 GHz, providing a 6.6' FWHM field of view.
Six 10.4 M OVRO telescopes were equipped for operation at 28.5
GHz, providing a 4.0' FWHM field of view. All field
observations were bracketed by observations of bright radio
point sources in order to track the phase fluctuations caused by
the instrument and the atmosphere.
Treatment of Radio Point Sources
Emission from radio point sources at 28.5 GHz will contaminate
SZ observations. To discriminate between the extended emission
from a cluster of galaxies and the point source emission from a
radio source, a hybrid array is used for the observations. The
majority of the telescopes are arranged in a compact
configuration. The short baselines formed by a pair of
telescopes in the compact configuration will be sensitive to all
structure on the sky that is smaller than ~2' in angular
diameter. The remaining telescopes are placed at distances
greater than ~100 ft from the close packed array. These
telescopes provide long baselines which are no longer sensitive
to the extended emission from the galaxy cluster. The long
baselines provide information about the point sources that can
be used to eliminate the effects of radio sources in the cluster
observations. Although the entire SZ analysis is performed
directly on the visibilities, it is informative to image the
effects of point source contamination and removal. Below is a
sequence of steps that demonstrates this process.
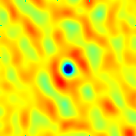
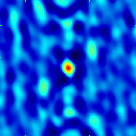 The first image is derived from only the short baselines of the
array. These baselines are sensitive to both radio point
sources and galaxy clusters. Note that the positive(red)
emission from the radio source dominates the signal. There is a
cluster of galaxies in this image, but it is impossible to
discriminate between the cluster and the point source using only
short baselines at 28.5 GHz.
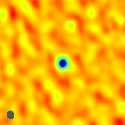
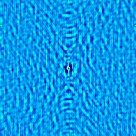 The second image is made from only the long baselines in the
array. The point source that appears on center is much smaller
in angular size than it was in the first image. In fact, the
noise features appear much finer in the second image than they
did in the first. This change in structure between the first
and second images results from the choice of baselines used in
imaging the data. The short baselines from the first image are
sensitive to large scale structure, the long baselines in the
second image provide a much finer resolution.
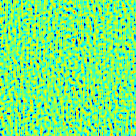 The point source at the center of the image is modeled from the
data in the second frame. The modeled source is subtracted
directly from the visibility data. The result is an image made
from the long baselines that is just instrumental noise. There
is no cluster of galaxies apparent in this image because the
extended emission is washed out by the high resolution of the
long baselines. The long baselines are simply not sensitive to
large scale structure.
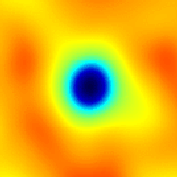
 The fourth image in the series is derived from the short
baselines again, but this time the point source that was
contaminating the data has been removed. Compare this image to
the first one. The structure in the image has changed. Where
there was originally just a bright radio point source, there is
now a bright cluster of galaxies which appears as a decrement
(deep blue/black) in the image. This data in the first image
was sensitive to this cluster, but the resolution was too coarse
to differentiate between the cluster and the point source.
Because the u-v coverage of an interferometer has a non-uniform
sampling, the fourier transform to the image plane creates an
image of the sky convolved with the a 'dirty' beam. This dirty
beam creates the ringing that is apparent in the image of the
cluster in the 4th panel. The rings that form around the
cluster are residual sidelobes from the dirty beam. To remove
this effect, the dirty beam is deconvolved from the image
resulting in a model for the signal on the sky. The image at
the bottom is the final result from the cleaning process.
Results
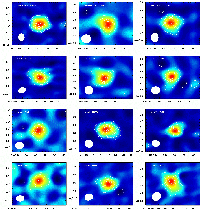 Over 40 clusters have been observed with the BIMA and OVRO
arrays. The figure above shows images of 12 of those clusters.
The scale in this figure is inverted so that a decrement
corresponding to the SZ signal is represented by the red end of
the color scale.
SZ observations have been combined with X-ray observations to
derive electron temperatures and electron densities associated
with a cluster. With knowledge of these quantities, it is
possible to model the absolute size of the cluster. From
geometrical arguments, it is then easy to determine the distance
to the cluster. These measurements have been used to constrain
the Hubble constant and cluster gas-mass fractions. BIMA and
OVRO observations yield a value of 60 +/- 3 km s-1
Mpc-1 for the Hubble constant and a baryon density of
ΩBh2 = 0.019 +/- 0.0012. For a more
detailed account of the analysis, see this paper or
this paper. The
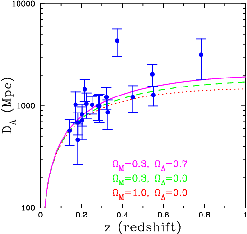
figure below shows the distance to the cluster derived from the
observations vs. redshift observed from emission lines in the
X-ray observations or optical observations. The colored lines
represent theoretical models assuming a given cosmology while
the points and corresponding error bars represent the values
derived for each cluster in the sample.
|
