ACBAR Home
Science Goals
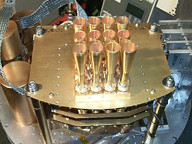
Instrument Description
Project Team
Publications
2006 Data
2002 Data
[2002 Press Release]
Photos
Links |
ACBAR Maps
Our cosmology findings are based on two maps we made of the CMB,
using the Acbar receiver on the Viper telescope at the South
Pole. These maps were made at a frequency of 150 GHz (wavelength
= 2mm), where the cosmic microwave background radiation is at
its brightest, using detectors (called bolometers) cooled to
0.25 Kelvin. These are the most sensitive high-resolution images
of the CMB yet made.
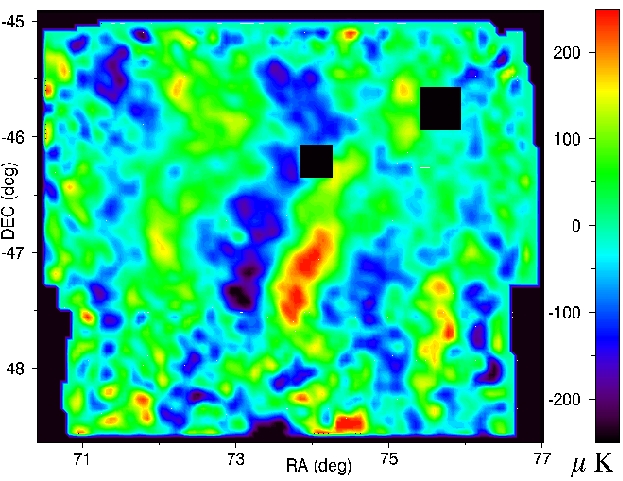
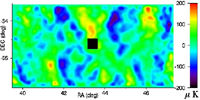
CMB2: This picture shows the map made on the field we
call "CMB2". The map is of a small patch of the southern sky
well away from the plane of our Galaxy, approximately 6 degrees
wide in Right Ascension by 3.5 degrees high in declination. The
colors show where the CMB is hot and bright, vs. where it is
cold and dim. In this map, the reds are hot and the blues are
cold. Because the CMB photons last interacted with matter when
the universe was 300,000 years old, this is a picture of the
universe at that time, long before any galaxies formed. The hot
and cold spots seen here are, in fact, the seeds from which
structures like galaxies and clusters of galaxies will later
form. The pattern of hot and cold spots is a random one; our
scientific results come from the relative strength of structure
on large vs. small scales in this map. The black squares in the
map were cut from the data because of radio sources at those
positions.
(Click on the image for full size .jpg, or click here for postscript format)
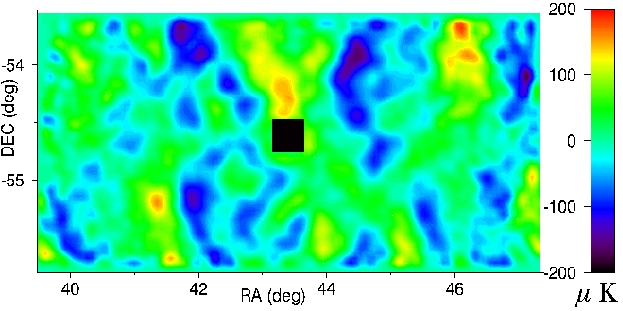
CMB5: This map is much like the CMB2 map, but on a
different patch of the sky. It is our most sensitive map, the
one we spent the longest making.
(Click on the image for full size .jpg, or click here
for postscript format)
|